叢集
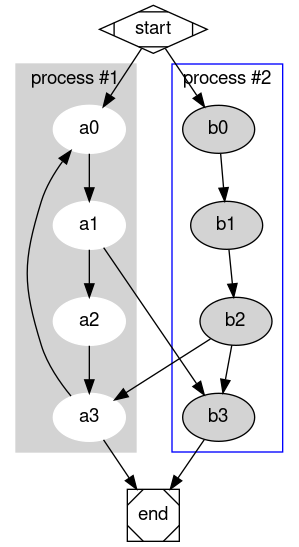
這個小範例說明了 dot 的功能,可以在叢集或獨立的矩形佈局區域中繪製節點和邊。叢集編碼為名稱前綴為「cluster」的子圖。叢集的顏色屬性會被解釋為其輪廓顏色,如果其樣式為「filled」,則會被解釋為背景顏色。Mdiamond 和 Msquare 是資料流程圖的修改符號。

cluster.gv.txt
digraph G {
	fontname="Helvetica,Arial,sans-serif"
	node [fontname="Helvetica,Arial,sans-serif"]
	edge [fontname="Helvetica,Arial,sans-serif"]

	subgraph cluster_0 {
		style=filled;
		color=lightgrey;
		node [style=filled,color=white];
		a0 -> a1 -> a2 -> a3;
		label = "process #1";
	}

	subgraph cluster_1 {
		node [style=filled];
		b0 -> b1 -> b2 -> b3;
		label = "process #2";
		color=blue
	}
	start -> a0;
	start -> b0;
	a1 -> b3;
	b2 -> a3;
	a3 -> a0;
	a3 -> end;
	b3 -> end;

	start [shape=Mdiamond];
	end [shape=Msquare];
}Copyright © 1996-2004 AT&T。保留所有權利。